The UK economy may slow down in the next couple of years, even while the world economy picks up, a report says.
The National Institute of Economic and Social Research (NIESR) revised up its forecasts for UK growth to 1.7% this year and 1.9% in 2018.
However, both would still be a slowdown from the growth rate of 2% recorded for 2016, when the UK was the world's fastest growing developed economy.
NIESR predicted inflation would rise too, hitting household spending.
"Robust consumer spending growth was behind the economic momentum of 2016," said Simon Kirby, head of macroeconomic modelling and forecasting at NIESR.
He said households would see their purchasing power "eroded" this year and in 2018 due to sharply rising prices.
Pound devaluation
The NIESR, widely seen as the UK's oldest independent research body, thinks inflation will jump from an average of 1.2% recorded over the course of 2016, to 3.3% this year then back down to 2.9% in 2018.
Price rises will be stoked, the body argues, by the sharp devaluation of the pound after the UK's Brexit vote last June.
The institute thinks the Bank of England will ignore this "temporary" pick-up in inflation and keep interest rates unchanged at their current historic low point, of just 0.25%, until the middle of 2019.
The Bank of England will announce its latest decision on interest rates on Thursday.
Here are the week’s leading indicators. The Dow Jones industrial average topped 20,000 points for the first time. British GDP grew 0.6% in the final quarter of 2016. The FTSE 100 and Germany’s DAX 30 persisted close to record highs, while US GDP softened slightly.
Bored yet? I am. As a former financial journalist, I’m well
acquainted with the merry-go-round of indicators that blip in and out of
our lives like digital dopamine, telling us how well we’re doing. As a
human being, I’m increasingly alarmed that these are just irrelevant
numbers that have little or no bearing on how well we are really doing.
Stock market indices have long been decoupled from what is happening
in the real world. All they reflect is the performance of big private
pension pots belonging to the haves (in Britain only 58% of people have private pensions and
the majority of those really very small), and how big the bonuses of a
few thousand money men (yes, mostly men) will be this year. Indeed, a company’s share price rising might be an indication of a
round of redundancies or other cost-cutting which makes shareholders
richer at the expense of staff. The number of people who should
celebrate the Dow hitting 20k is truly tiny. Most of them wouldn’t be
much fun to go out for a beer with.
As for GDP, has there ever been an acronym as spellbindingly dismal
as this? GDP goes up if you sit in traffic for an hour with the engine
ticking over. It doesn’t if you stay at home, caring for a sick child.
GDP has soared in China over the past 20 years. Now its people wear
masks in the street to filter the smog. GDP can’t measure the things
that are really important to us – our health, relationships, environment
– but can and does measure when industries strip-mine the Earth to make
gimcrack that nobody wants but which people buy anyway, and then throw
away.
This is not to deride the herculean efforts of journalists who follow this stuff, like our own Graeme Wearden, who tries to makes sense of the blizzard of financial data spewed out every day here.
Instead, I’d rather suggest a series of other metrics that give a
clearer indication of where humanity is at. Perhaps these are the key
performance indicators we should hardwire into our reporting calendar:
One of the lessons of the 20th century was that inequality breeds
revolt and revolutions never end well. One of the lessons of the 21st
century is that people seem to be determined not to learn the lessons of
the 20th century. The Gini coefficient is a crude measure of how unequal societies are becoming. Some economists have been toying with another measure, the Palma ratio,
which is better at discerning how much richer the richest cohort are
getting, compared with the poorest. Both tell us much about our
direction of travel.
The Western industrialized countries include the countries of Western Europe, as well as Australia, Canada, Japan, New Zealand, South Africa,
and the United States. Soviet trade with industrialized countries,
except Finland, consisted of simple purchases paid for on a cash or
credit basis, direct exchange of one good for another (Pepsi-Cola for Stolichnaya vodka,
for example), or industrial cooperation agreements in which foreign
firms participated in the construction or operation of plants in the
Soviet Union. In the latter instances, payments were rendered in the
form of the output of new plants.
By contrast, trade with Finland, which
did not have a convertible currency at that time, was conducted through
bilateral clearing agreements, much like Soviet trade with its Comecon
partners.[1]
In the 1970s and 1980s, the Soviet Union relied heavily on various
kinds of fuel exports to earn hard currency, and Western partners
regarded the Soviet Union as an extremely reliable supplier of oil and
natural gas. In the 1980s, the Soviet Union gave domestic priority to
gas, coal, and nuclear power in order to free more oil reserves for
export. This was necessary because of higher production costs and losses
of convertible currency resulting from the drop in world oil price
. The development of natural gas for domestic and export use was also
stimulated by these factors. Between 1970 and 1986, natural gas exports
rose from 1 percent to 15 percent of total Soviet exports to the West.[1]
Because of the inferior quality of Soviet goods, the Soviet Union was
unsuccessful in increasing its exports of manufactured goods. In 1987
only 18 percent of Soviet manufactured goods met world technical
standards. As an illustration of these problems in quality, Canadian
customers who had purchased Soviet Belarus tractors often found that the
tractors had to be overhauled on arrival before they could be sold on
the Canadian market. In 1986 less than 5 percent of Soviet exports to
the West consisted of machinery. Other Soviet nonfuel exports in the
1990s included timber, exported primarily to Japan, and chemicals, the
export of which grew substantially in 1984 and 1985.[1]
In the 1980s, Soviet imports from Western industrialized countries
generally exceeded exports, although trade with the West decreased
overall. One-half of Soviet agricultural imports were from developed
countries, and these imports made up a considerable portion of total
imports from the West. Industrial equipment formed one-quarter of Soviet
imports from the West, and iron and steel products, particularly steel
tubes for pipeline construction, made up most of the rest. Over the
course of the 1980s, high-technology items gained in importance as well.[1]
In the 1970s and 1980s, Soviet trade with the Western industrialized
countries was more dynamic than was Soviet trade with other countries,
as trade patterns fluctuated with political and economic changes. In the
1970s, the Soviet Union exchanged its energy and raw materials for
Western capital goods, and growth in trade was substantial. Soviet
exports jumped 55 percent, and imports jumped 207 percent. The Soviet
Union ran a trade deficit with the West throughout this period.[1]
In 1980 the Soviet Union exported slightly more to the West than it
imported. After a temporary shortage of hard currency in 1981, the
Soviet Union sought to improve its trade position with the
industrialized countries by keeping imports at a steady level and by
increasing exports. As a result, the Soviet Union began to run trade
surpluses with most of its Western partners. Much of the income earned
from fuel exports to Western Europe was used to pay off debts with the
United States, Canada, and Australia, from which the Soviet Union had
imported large quantities of grain.[1]
In 1985 and 1986, trade with the West was suppressed because of
heightened East-West political tensions, successful Soviet grain
harvests, high Soviet oil production costs, a devalued United States
dollar, and falling oil prices. Despite increases in oil and natural gas
exports, the Soviet Union's primary hard-currency earners, the country
was receiving less revenue from its exports to the West. The Soviet
Union sold most of its oil and natural gas exports for United States
dollars but bought most of its hardcurrency imports from Western Europe.
The lower value of the United States dollar meant that the purchasing
power of a barrel of Soviet crude oil, for example, was much lower than
in the 1970s and early 1980s. In 1987 the purchasing power of a barrel
of Soviet crude oil in exchange for West German goods had fallen to
one-third of its purchasing power in 1984.[1]
With the exception of grain, phosphates used in fertilizer
production, and high-technology equipment, Soviet dependence on Western
imports historically has been minimal. A growing hardcurrency debt of
US$31 billion in 1986 led to reductions in imports from countries with
hard currencies. In 1988 Gorbachev cautioned against dependence on
Western technology because it required hard currency that ""we don't
have."" He also warned that increased borrowing to pay for imports from
the West would lead to dependence on international lending institutions.[1]
United States
Trade
between the United States and the Soviet Union averaged about 1 percent
of total trade for both countries through the 1970s and 1980s.
Soviet-American trade peaked in 1979 at US$4.5 billion, exactly 1
percent of total United States trade. The Soviet Union continuously ran a
trade deficit with the United States in the 1970s and early 1980s, but
from 1985 through 1987 the Soviet Union cut imports from the United
States while maintaining its level of exports to balance trade between
the two countries.[1]
In 1987 total trade between the United States and the Soviet Union
amounted to US$2 billion. The Soviet Union exported chemicals, metals
(including gold), and petroleum products in addition to fur skins,
alcoholic beverages, and fish products to the United States and received
agricultural goods—mostly grain—and industrial equipment in return. The
value of exports to the Soviet Union in 1987 amounted to US$1.5
billion, three-quarters of which consisted of agricultural products and
one-quarter industrial equipment.[1] Competition from other parts of the world, improvements in Soviet
grain production, and political disagreements between the two countries
adversely affected American agricultural exports to the Soviet Union in
the 1980s. In 1985 and 1986, trade was the lowest since 1973. The Soviet
Union had turned to Canada and Western Europe for one-third of its
grain supplies, as well as to Argentina, Eastern Europe, Australia, and
China. United States government price subsidies helped to expand grain
exports in 1987 and 1988.[1]
The United States has long linked trade with the Soviet Union to its
foreign policy toward the Soviet Union and, especially since the early
1980s, to Soviet human rights policies. In 1949, for example, the Coordinating Committee for Multilateral Export Controls
( CoCom—see Glossary) was established by Western governments to monitor
the export of sensitive high technology that would improve military
effectiveness of members of the Warsaw Pact and certain other countries. The Jackson-Vanik Amendment, which was attached to the 1974 Trade Reform Act, linked the granting of most-favored-nation to the right of Soviet Jews to emigrate.[1]
In 1987 the United States had reason to reassess its trade policy
toward the Soviet Union. The Soviet Union had restructured and
decentralized authority for trade under the Ministry of Foreign Trade,
made improvements in human rights policies, cooperated in arms control
negotiations, and shown a willingness to experiment with joint ventures.
Furthermore, the United States government recognized that restrictive
trade policies were hurting its own economic interests. In April 1988,
Soviet and American trade delegations met in Moscow to discuss
possibilities for expanded trade. Through increased trade with the
United States, the Soviet Union hoped to learn Western management,
marketing, and manufacturing skills. Such skills would increase the
ability of the Soviet Union to export manufactured goods, and thus earn
hard currency, and would improve its competitiveness on the world
market. The delegations declared that Soviet-American cooperation would
be expanded in the areas of food processing, energy, construction
equipment, medical products, and the service sector.[1]
Western Europe
In
the mid-1980s, West European exports to the Soviet Union were marginal,
less than 0.5 percent of the combined gross national product of
countries of the Organization for Economic Cooperation and Development.
OECD countries provided the Soviet Union with high-technology and
industrial equipment, chemicals, metals, and agricultural products. In
return, Western Europe received oil and natural gas from the Soviet
Union.[1] Although oil and gas were the primary Soviet exports to Western
Europe, they represented only a small percentage of Western Europe's
substantial fuel imports: Soviet oil provided 3 percent and natural gas 2
percent of the energy consumed in Western Europe. The completion of the
Urengoy-Uzhgorod export pipeline project increased the importance of
Soviet natural gas to Western Europe in the second half of the 1980s. In
1984 France, Austria, the Federal Republic of Germany
(West Germany), and Italy began receiving natural gas from western
Siberia through the pipeline, for which the Soviet Union was paid in
hard currency, pumping equipment, and large-diameter pipe. By 1990 the
Soviet Union expected to supply 3 percent of all natural gas imported by
Western Europe, including 30 percent of West Germany's gas imports.[1]
Unlike the United States, the countries of Western Europe have not
viewed trade as a tool to influence Soviet domestic and foreign
policies. Western Europe rejected the trade restrictions imposed by the
United States after the Soviet invasion of Afghanistan in 1979 and the
declaration of martial law in Poland in 1980. From 1980 to 1982, the
United States embargoed the supply of equipment for the Urengoy-Pomary-Uzhgorod pipeline, but Western Europe ignored United States pleas to do the same.[1] Despite the poor relations between the superpowers in the early and
mid-1980s, Western Europe tried to improve international relations with
the Soviet Union. One major step in this direction was the normalization
of relations between Comecon and the European Economic Community (EEC).
After fifteen years of negotiations, the EEC approved an accord that
established formal relations with Comecon effective June 25, 1988.
Although it did not establish bilateral trade relations, the agreement
""set the stage"" for the exchange of information. This accord marked
Comecon's official recognition of the EEC.[1]
Japan
In 1985
trade with the Soviet Union accounted for 1.6 percent of Japanese
exports and 1 percent of Japanese imports; Japan was the Soviet Union's
fourth most important Western trading partner. Japan's principal exports
to the Soviet Union included steel (approximately 40 percent of Japan's
exports to the Soviet Union), chemicals, and textiles. The Soviet Union
exported timber, nonferrous metals, rare-earth metals, and fuel to
Japan. In 1986, despite a reduction in trade between the two countries,
the Soviet Union had a trade deficit with Japan. In 1987 trade dropped
another 20 percent.[1]
Numerous controversies have thwarted Soviet-Japanese trade. The
Toshiba affair, in which Japan was accused of shipping equipment to the
Soviet Union that was prohibited by CoCom, caused Japanese-Soviet trade
to decrease in 1987. In addition, the Japanese constantly prodded the
Soviet Union to return the islands off the Japanese island of Hokkaidō
that had come under Soviet control after World War II. For its part,
the Soviet Union complained of the trade imbalance and static structure
of Japanese-Soviet trade.[1] In the late 1980s, the Soviet Union tried to increase its exports to
Japan and diversify the nature of the countries' relationship. Soviet
proposals have included establishing joint enterprises to exploit
natural resources in Siberia and the Soviet Far East, specifically, coal
in the southern Yakutiya area of Siberia and petroleum on Sakhalin;
cooperating in the monetary and credit fields; jointly surveying and
studying marine resources and peaceful uses of space; and establishing
joint activities in other countries. The Soviet Union also proposed
branching out into joint ventures in the chemical and wood chip
industries, electronics, machine tools, and fish processing.
The first Japanese-Soviet joint enterprise, a wood-processing plant in
the Soviet Far East, began operation in March 1988. The Soviet Union
provided the raw materials, and Japan supplied the technology,
equipment, and managerial expertise.[1]
Finland
In
contrast to the variable trade relationships the Soviet Union has had
with other West European countries, its relationship with Finland has
been somewhat stable because of five-year agreements that regulated
trade between the countries. The first was established in 1947, and 1986
marked the beginning of the eighth. Accounting procedures and methods
of payment were agreed upon every five years as well by the Bank of Finland and Vneshtorgbank. A steady growth in trade between the two countries occurred throughout the 1970s and 1980s.[1] In the late 1980s, Finland was the Soviet Union's second most
important trading partner among the Western nations, after West Germany.
Trade with Finland, however, was based on bilateral clearing agreements
rather than on exchange of hard currency used with other Western
trading partners. In 1986 the Soviet Union shipped 4 percent of its
exports to and received 3 percent of its imports from Finland. Finland
provided the Soviet Union with ships, particularly those suited to
Arctic conditions; heavy machinery; and consumer goods such as clothing,
textiles, processed foodstuffs, and consumer durables. The Soviet Union
exported oil, natural gas, and fuel and technology for the nuclear
power industry.[1] The system of bilateral clearing agreements on which Soviet-Finnish
trade was based required that any increase in Finnish imports from the
Soviet Union be accompanied by a corresponding increase in exports to
the Soviet Union in order to maintain the bilateral trade balance. At
the beginning of the 1980s, Finland increased its imports of Soviet oil,
which allowed it to increase its exports to the Soviet Union. This
procedure accounted for the steady growth in Soviet-Finnish trade into
the late 1980s. By 1988 about 90 percent of Soviet exports to Finland
consisted of oil. Because the Finns imported more oil than they could consume domestically, they reexported it to other Scandinavian
and West European countries. The Finns complained in late 1987 and
early 1988 of a decline in Soviet ship orders and delinquent payments.
The share of Finland's exports to the Soviet Union, which had previously
been as high as 25 percent, dropped to 15 percent in 1988.[1]
Economic growth means an increase in real national income / national output.
Economic development means an improvement in quality of life and
living standards, e.g. measures of literacy, life-expectancy and health
care.
Ceteris paribus,
we would expect economic growth to enable more economic development.
Higher real GDP, enables more to be spent on health care and education.
However, the link is not guaranteed. The proceeds of economic growth could be wasted or retained by a small wealthy elite
Economic development
Development looks at a wider range of statistics than just GDP per
capita. Development is concerned with how people are actually affected.
It looks at their actual living standards and the freedom they have to
enjoy a good standard of living. Measures of economic development will look at:
Real income per head – GDP per capita
Levels of literacy and education standards
Levels of health care e.g. number of doctors per 1000 population
Economic growth means an increase in real GDP. Economic growth means
there is an increase in national output and national income.
Economic growth is caused by two main factors:
an increase in aggregate demand (AD)
an increase in aggregate supply (productive capacity)
Demand side causes
In the short term, economic growth is caused by an increase in
aggregate demand (AD). If there is spare capacity in the economy then an
increase in AD will cause a higher level of real GDP. AD= C + I + G + X- M
C= Consumer spending
I = Investment (gross fixed capital investment)
G = Government spending
X = Exports
M = Imports
Long term economic growth
This requires an increase in the long run aggregate supply (productive capacity) as well as AD.
LRAS or potential growth can increase for the following reasons:
Increased capital. e.g. investment in new factories or investment in infrastructure, such as roads and telephones.
Increase in working population, e.g. through immigration, higher birth rate.
Increase in labour productivity, through better education and training or improved technology.
Discovering new raw materials.
Technological improvements to improve the productivity of capital
and labour e.g. Microcomputers and the internet have both contributed to
increased economic growth.
The dictionary definition of ‘development’ is to improve, to
progress, or to grow – but development is not just about growth! It is
concerned with the improvement of human welfare within an economy, and
so it encompasses concepts such as the standard of living, cultural
identity and political freedom.
The most common measurement of development is the
Human Development Index published each year by the United Nations
Development Programme.
Dudley Sears has defined development as “the reduction and
elimination of poverty, inequality and unemployment within a growing
economy”. Under this definition, development is essentially about
improving the incomes of those living in poverty.
The Nobel Economist Amartya Sen, writing in
“Development as Freedom”, sees development as being concerned with
improving the freedoms and capabilities of the disadvantaged, thereby
enhancing the overall quality of life. Development should be about increasing political freedom, economic
freedom, and social freedom and not just about raising incomes.
Other measures of economic and social development:
There are many indicators that one might choose to consider when
taking a broad look at the process of economic development, here is a
selection:
1. The percentage of adult male and female labour in agriculture, % of arable land that is cultivated 2. Combined primary and secondary school enrolment figures and other
indicators of progress in building human capital. 1990 HDR started with
this phrase: “People are the real wealth of a nation.” 3. Access to clean water / improved sanitation facilities (% of population with access) 4. Energy consumption per capita 5. Depth of hunger, kilocalories per day per capita 6. Prevalence of HIV, average life expectancy at birth, years of healthy life expectancy, child mortality 7. Access to mobile cellular phones per thousand of the population 8. Percentage of the population living in extreme poverty 9. Dependence on foreign aid / levels of external debt 10. Percentage of households with a bank account 11. Unemployment rates and vulnerable employment rates 12. High-technology exports (% of manufactured exports) 13. The Human Development Index (covered in a later section of this chapter) 14. Progress in achieving the Millennium Development Goals Michael Todaro specified three objectives of development: 1. To increase the availability and widen the distribution of basic
life-sustaining goods such as food, shelter, health and protection. 2. To raise levels of living, including, in addition to higher
incomes, the provision of more jobs, better education, and greater
attention to cultural and human values, all of which will serve not only
to enhance material well-being but also to generate greater individual
and national self-esteem 3. To expand the range of economic and social choices available to
individuals and nations by freeing them from servitude and dependence
not only in relation to other people and nation-states but also to the
forces of ignorance and human misery. Note the emphasis on ‘cultural and human values’, ‘self-esteem’ and
freedom from ignorance; it is important to remember that economic
development is about much more than simply achieving economic growth.
Soviet foreign trade played only a minor role in the Soviet economy. In 1985, for example, exports and imports each accounted for only 4 percent of the Soviet gross national product. The Soviet Union
maintained this low level because it could draw upon a large energy and
raw material base, and because it historically had pursued a policy of
self-sufficiency. Other foreign economic activity included economic aid programs, which primarily benefited the less developed Council for Mutual Economic Assistance (COMECON) countries of Cuba, Mongolia, and Vietnam, and substantial borrowing from the West to supplement hard-currency export earnings.[1]
The Soviet Union conducted the bulk of its foreign economic activities with communist countries, particularly those of Eastern Europe.
In 1988 Soviet trade with socialist countries amounted to 62 percent of
total Soviet foreign trade. Between 1965 and 1988, trade with the Third World made up a steady 10 to 15 percent of the Soviet Union's foreign trade. Trade with the industrialized West, especially the United States,
fluctuated, influenced by political relations between East and West, as
well as by the Soviet Union's short-term needs. In the 1970s, during
the period of détente, trade with the West gained in importance at the
expense of trade with socialist countries. In the early and mid-1980s,
when relations between the superpowers were poor, however, Soviet trade
with the West decreased in favor of increased integration with Eastern
Europe.[1]
The manner in which the Soviet Union transacted trade varied from one
trade partner to another. Soviet trade with the Western industrialized
countries, except Finland,
and most Third World countries was conducted with hard currency, that
is, currency that was freely convertible. Because the ruble was not
freely convertible, the Soviet Union could only acquire hard currency by
selling Soviet goods or gold on the world market for hard currency.
Therefore, the volume of imports from countries using convertible
currency depended on the amount of goods the Soviet Union exported for
hard currency. Alternative methods of cooperation, such as barter,
counter trade, industrial cooperation, or bilateral clearing agreements
were much preferred. These methods were used in transactions with
Finland, members of Comecon, the People's Republic of China, Yugoslavia, and a number of Third World countries.[1]
Commodity composition of Soviet trade differed by region. The Soviet
Union imported manufactured, agricultural, and consumer goods from
socialist countries in exchange for energy and manufactured goods. The
Soviet Union earned hard currency by exporting fuels and other primary
products to the industrialized West and then used this currency to buy
sophisticated manufactures and agricultural products, primarily grain.
Trade with the Third World usually involved exchanging machinery and
armaments for tropical foodstuffs and raw materials.[1]
Soviet aid programs expanded steadily from 1965 to 1985. In 1985 the
Soviet Union provided an estimated US$6.9 billion to the Third World in
the form of direct cash, credit disbursements, or trade subsidies. The
communist Third World, primarily Cuba, Mongolia, and Vietnam, received
85 percent of these funds. In the late 1980s, the Soviet Union
reassessed its aid programs. In light of reduced political returns and
domestic economic problems, the Soviet Union could ill afford
ineffective disbursements of its limited resources. Moreover,
dissatisfied with Soviet economic assistance, several Soviet client
states opened trade discussions with Western countries.[1]
In the 1980s, the Soviet Union needed considerable sums of hard
currency to pay for food and capital goods imports and to support client
states. What the country could not earn from exports or gold sales it
borrowed through its banks in London, Frankfurt, Vienna, Paris, and Luxembourg.
Large grain imports pushed the Soviet debt quite high in 1981. Better
harvests and lower import requirements redressed this imbalance in
subsequent years. By late 1985, however, a decrease in oil revenues
nearly returned the Soviet debt to its 1981 level. At the end of that
same year the Soviet Union owed US$31 billion (gross) to Western
creditors, mostly commercial banks and other private sources.[1]
In the late 1980s, the Soviet Union attempted to reduce its
hard-currency debt by decreasing imports from the West and increasing
oil and gas exports to the West. It also sought increased participation
in international markets and organizations. In 1987 the Soviet Union
formally requested observer status in the General Agreement on Tariffs and Trade and in 1988 signed a normalization agreement with the European Economic Community.
Structural changes in the foreign trade bureaucracy, granting direct
trading rights to select enterprises, and legislation establishing joint
ventures with foreigners opened up the economy to the Western technical
and managerial expertise necessary to achieve the goals established by
General Secretary Mikhail Gorbachev's program of economic restructuring (perestroika).[1]
The BRICS club (Brazil, Russia, India, China and South Africa),
which used to be known for its tremendous growth potential, is today in
the midst of severe economic and political woes. Apart from the Federal
rate increase which has contributed to the mounting debt burden for
these economies; falling global commodity prices have affected these
emerging markets which rely heavily on export led growth.
Moreover, the structural transformation of China, which has been
the main driver of this group, from an export driven economy to a one
relying on domestic consumption, has added to the current woes of BRICS.
Among these economies, India is the only country which has shown signs
of strong potential for growth. It has largely benefited from being a
net importer of crude and other commodities whose prices have fallen and
also has the advantage of being less susceptible to the market
volatility as it is less dependent on exports for its growth. The share
of exports of goods and services in GDP in 2014 was 23.2% in India,
while that of Russia was 30% and South Africa was 31.3%.
Image: Reuters
India has the lowest per capita GDP of $5,238 among the other
members of the bloc and is also lagging behind the other BRICS economies
in terms of quality of life. However, economic reforms initiated by the
Indian Prime Minister Narendra Modi, have led to greater foreign
investments and improved economic competitiveness in recent times.
India’s ranking in the World Economic Forum’s, Global Competitiveness Report
improved from 71 in 2014 to 55 in 2015. Nevertheless, excluding Brazil,
all the other BRICS countries are still ranked higher than India in the
report.
In terms of social development, BRICS economies have shown a mixed
performance. In the Social Progress Index (SPI) developed by the Social
Progress Imperative, a nonprofit organization based in Washington,
Brazil (70.89) surpasses all the other member countries, followed by
South Africa (65.64), Russia (63.64), China (59.07) and India (53.06).
Meanwhile, Russia outperforms the rest of the economies in terms of
Basic Human Needs (Nutrition and basic medical care, Air, water and
sanitation, Shelter and Personal safety), Brazil leads the group on
Foundations of Wellbeing (Access to basic knowledge, Access to
information and communication, Health and wellness, and Ecosystem
sustainability) and Opportunity (Personal rights, Access to higher
education, Personal freedom and choice and Tolerance and inclusion)
dimensions of the SPI. India, which belongs to the group of low social
progress countries, falls behind the other BRICS countries in both Basic
Human Needs and Foundations of Wellbeing and only stays ahead of China
in the Opportunity dimension.
Further assessment of the SPI for the bloc shows that Personal
safety has been an area of concern in South Africa and Brazil. The
homicide rate, defined as deaths deliberately inflicted on a person by
another person, per 100,000 people, is 5 on a scale of 1-5 for both
countries. In contrast, China has the lowest homicide rate of 1.
Moreover, the rate of traffic deaths has been observed to be the
highest for South Africa, followed by Brazil. Areas such as Water,
Sanitation and Shelter have been challenging for India primarily due to
lack of access to piped water, improved sanitation facilities,
electricity and household air pollution. In addition to this, India has
about 15% of its population which is undernourished, as compared to
Brazil, Russia and South Africa which have only 5% undernourished
people.
Maternal mortality rate and child mortality rates are also very
high in India relative to the others in the group. On the front of
health and wellness, South Africa has the lowest life expectancy for its
population (56.1) and China has the highest (75.2). Another major
aspect of a nation’s wellbeing is its environmental sustainability,
which could be measured by its amount of greenhouse gas emissions.
China, Russia and South Africa have high content of greenhouse gas
emissions relative to Brazil and India.
On the dimension of Education, Russia has the highest adult
literacy rate of 99.7%, while India lags behind with 71.2%. Moreover,
India sees the highest inequality in education among the other BRICS
economies. The average number of years of school attended by women
between the age group of 25-35 years is as low as 5.6 compared to Russia
(13.8) and South Africa (10.4). Another major aspect which is crucial
to a nation’s prosperity is Tolerance and inclusion. While, India shows a
weak performance on this front compared to other countries, it stays
far ahead of China and Russia on personal rights such as political
rights, private property rights and the like.
Thus, while the BRICS countries (except for India) have shared a
common economic downturn in recent times, their social environments are
diverse in several respects. A cross country comparison for the BRICS
shows that economic progress alone may not necessarily translate into a
higher quality of life for these economies. The chart below shows that
countries such as Brazil and South Africa, which lag behind Russia in
GDP per capita, are socially more progressive. In 2015, Russia (GDP per
capita of $23,564) had a SPI score of 63.64, while Brazil (GDP per
capita of $14,555) and South Africa (GDP per capita of $12,106) had SPI
scores of 70.89 and 65.64, respectively. Similar trends between GDP per
capita and SPI have been found also outside the BRICS club, in countries
such as the US, which has been ranked 16 for social progress. Countries
such as UAE, Kuwait and Saudi Arabia have also achieved a low social
progress score compared to their level of GDP per capita.
Image: socialprogressimperative.org
Since social progress of a nation may also affect its economic
prosperity, it is crucial for nations to undertake measures in the
social spheres in which they are lagging behind. While India still needs
to invest its resources in meeting its basic human needs, countries
such as China and Russia need to bring about institutional changes that
could protect the rights and freedom of its people. The bloc needs to
address environmental issues by building energy efficient technologies
that could lead to the path of sustainable development. Among the BRICS
economies, South Africa, China and Russia should lay greater emphasis on
policy dialogues to reduce the extent of their greenhouse gas
emissions. In addition to this, South Africa and Brazil should focus on
ensuring personal safety to its people. Greater government support
through increased spending on social sectors or though policy changes
may promote social development and protect the falling BRICS.
A measure in this direction has been taken up by the Brazilian
economy through a construction of SPI for its Amazon region, which
covers 772 municipalities and nine states. The region has been marked
down for social development compared to other regions of Brazil,
primarily due to activities such as deforestation, leading to depletion
of natural resources. Such sub-national level initiatives can play a
pivotal role in fostering social progress, through identification of
specific communities where a country is falling behind, and assist in
designing development models targeting the social or environmental
progress of these regions.
The UK economy will see three years
of "relatively slow growth" as it comes to rely more on trade and less
on consumer spending, a think tank says.
The influential EY Item
Club said higher inflation caused by a weaker pound would result in GDP
growth of 1.3% in 2017 and just 1% next year.
But it said rising demand for exports would offset this somewhat. A separate survey has found optimism in the financial services sector hit its lowest level since the 2008 crash.
Sterling
has fallen by 17% against the dollar since the UK voted to quit the
European Union last June, increasing import costs and pushing up shop
prices. In its latest forecast,
the EY Item Club said it expected inflation to rise to 3.1% by the
final quarter of 2017 before easing back to 2% by the end of 2018. On
top of this, it said unemployment was likely to climb from 4.8% in the
final quarter of last year to more than 6% by the end of 2018. "[These
factors are] expected to have a knock-on impact on consumer spending,
as growth in disposable incomes is eroded," the think tank said.
Export growth
But
the agency also said that a "weaker pound and a softer domestic market"
were likely to encourage higher levels of UK exports, as businesses
seek income opportunities overseas. It expects exports to increase by 3.3% this year and 5.2% in 2018.
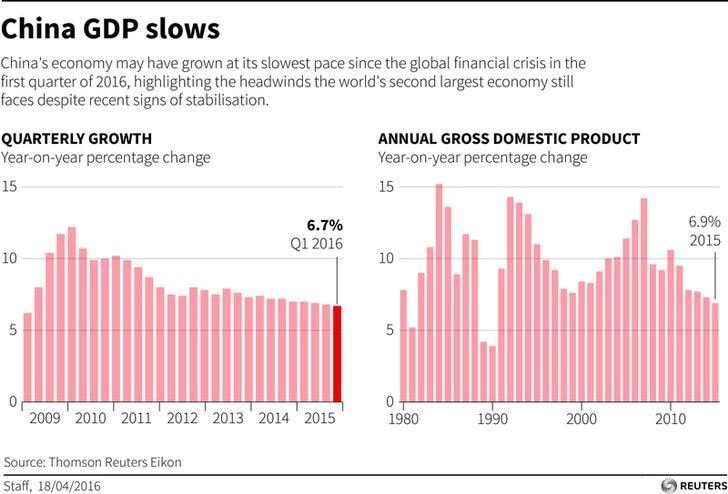
China's economy grew by 6.7% in
2016, compared with 6.9% a year earlier, according to official data,
marking its slowest growth since 1990.
The figure is in line with Beijing's growth target of between 6.5% and 7%. But the data comes days after the leader of one Chinese province admitted GDP data was faked for several years. China is a key driver of the global economy and a growth slowdown is a major concern for investors around the world.
'Deception'
Some
analysts have taken heart from data showing growth in the last three
months of 2016 was at an annual rate of 6.8% - a slightly faster pace
than the rest of the year. But many observers have been saying for years that the country's growth was actually much weaker than the official data suggests.
And
those beliefs gained more support this week, when the governor of
Liaoning, Chen Qiufa, said his province had been "involved in a
large-scale financial deception" between 2011 and 2014, and that
economic data had been doctored.
Addressing reporters' questions
about the Liaoning admission, the director of the National Bureau of
Statistics said on Friday that the national data was "truthful and
reliable". Ning Jizhe added that "statistics departments on
various levels will also be strengthening the law enforcement,
supervision, and checks on figures" and "resolutely guarding and
preventing" the fabricating of data.
Official figures this week are expected to provide fresh evidence
that the UK economy remained resilient in the face of Brexit uncertainty
at the close of 2016 but economists warn Britain is headed for a sharp
slowdown this year. After confounding most economic forecasters with solid GDP growth of 0.6% in the three months following June’s referendum, the economy is expected to have grown 0.5% in the final quarter of last year, according to a Reuters poll of economists. Chris Hare, economist at the bank Investec was among those predicting
the GDP figures on Thursday would show a strong finish to the year.
“The UK economy has held up remarkably well after last June’s vote to
leave the EU. Businesses and households have largely shrugged off the
political and economic uncertainties relating to Brexit, keeping the
economy running at a decent pace,” he said.
Hopes of solid growth have been buoyed by largely upbeat surveys of
businesses and consumers. In particular, the Markit/CIPS purchasing
managers’ indices (PMIs) showed the construction, manufacturing and services sectors all grew at the end of 2016 and pointed to 0.5% GDP growth in the final quarter.
The UK economy will grow faster
than expected this year this year, but Britain could face a tougher time
in the long-term amid “tough and prolonged” Brexit negotiations with
the European Union, according to a report from the influential EY Item
Club.
The organisation has pencilled in UK GDP growth of 1.3pc in 2017 - an
substantial upgrade on earlier forecasts of 0.8pc - but expects this to
slow to 1pc in 2018, before picking up to 1.4pc in 2019 and 1.8pc in
2020.
These forecasts are based on assumptions the the UK will trade with
the EU under World Trade Organisation rules, rather than privileged
access to the single market, and that negotiations will be “tough and
prone to setback”.
The good news, however, is that the weak pound should provide a
helpful boost to the country’s export industry and multi-national
companies, many of whom generate income in foreign currencies, such as
US dollars.
Relationship between wages, productivity and inflation
Some Generalizations
Wages are positively related to labor productivity.
As labor productivity increases, wages increase.
If
nominal wages increase faster than increase in labor productivity, we
will have inflation in the economy, equal to that differential.
If nominal wages increase by 5%, while labor productivity has only increased by 2%, inflation will be around 3%.
This is because output (dependent on labor productivity) is increasing at a slower rate than increase in nominal wages.
It is a case of "more money chasing fewer goods", the quintessential prerequisite for inflation.
The
reverse will also be true. If nominal wages increase slower than
increase in labor productivity, we will not have inflation (possibly
deflation) in the economy.
If nominal wages increase by 2%,
while labor productivity has increased by 5%, deflation will be around
3% (same as -3% inflation).
This is because output (dependent
on labor productivity) is increasing at a faster rate than increase in
nominal wages, thus prices do not rise, indeed they may fall
(deflation).
If nominal wages increase at the same rate as
increase in labor productivity, we will not have either inflation or
deflation in the economy.
If nominal wages increase by 5%, and labor productivity also increases by 5%, neither inflation nor deflation will be present.
This is because output (dependent on labor productivity) is increasing at the same rate as the increase in nominal wages.
These are generalizations and hence generally tend to hold true.
The Human Development index is a measure of economic development and
economic welfare. The Human Development Index examines three important
criteria of economic development (life expectancy, education and income
levels) and uses this to create an overall score between 0 and 1.
1 indicates a high level of economic development, 0 a very low level.
The HDI combines:
Life Expectancy Index. Average life expectancy compared to a global expected life expectancy..
Education Index
mean years of schooling
expected years of schooling
Income Index (GNI at PPP)
What the HDI shows.
The HDI give an overall index of economic development. It has some
limitations and excludes several factors that might have been included,
but it does give a rough ability to make comparisons on issues of
economic welfare – much more than just using GDP statistics show.
Limitations of Human Development Index
Wide divergence within countries. For example, countries like China
and Kenya have widely different HDI scores depending on the region in
question. (e.g. north China poorer than south east)
HDI reflect long-term changes (e.g. life expectancy) and may not respond to recent short-term changes.
Higher National wealth GNI may not necessarily increase economic welfare, it depends how it is spent.
Also higher GNI per capita may hide widespread inequality within a
country. Some countries with higher real GNI per capita have high levels
of inequality (e.g. Russia, Saudi Arabia)
However, HDI can highlight countries with similar GNI per capita but different levels of economic development.
Economic welfare depends on several other factors, such as – threat
of war, levels of pollution, access to clean drinking water e.t.c.